Friday 30 June 2017

Breakout or Breakdown: Why the Next Two Weeks Will be Critical For the Rally, June 30, 2017

The Sevens Report is the daily market cheat sheet our subscribers use to keep up on markets, seize opportunities, avoid risks and get more assets.

We’re coming to a bit of a fork in the road here in markets and the economy.

The market appears to be accepting the reality that even with some lackluster economic data, global central banks are going to remove stimulus and tighten financial conditions. So now, the economic data becomes very important.

On one hand (this is the bear’s scenario) if the data stays middling (but not bad enough to warrant central banks to get dovish again) then stocks could be in trouble, with similar price action to what we’ve seen this week. Put broadly, that’d be a global rising rate environment with slow growth and stagnant inflation, which won’t be great for stocks, especially when they are trading at 18X next year’s earnings.

On the other hand, if economic data (growth and inflation) starts to accelerate, then we’ve got renewed reflation, which will be positive for banks, small caps and cyclicals. And, they can power this market higher after a period of volatility (like we’ve seen this week).

Once again, we get a lot of important economic data over the next 10 days that will help decide which “fork” the market takes. It’s the middle of summer, but now it’s time to pay attention, because there will be potential opportunities coming out of the next two weeks of data and news.

It’s also a good time to sign up for your free 2-week trial of The Sevens Report.

Join hundreds of advisors from huge brokerage firms like Morgan Stanley, Merrill Lynch, Wells Fargo Advisors, Raymond James and more… see if The Sevens Report is right for you with a free two-week trial.

Time is Money

The post Breakout or Breakdown: Why the Next Two Weeks Will be Critical For the Rally, June 30, 2017 appeared first on Sevens Report.


source https://sevensreport.com/breakout-breakdown-next-two-weeks-will-critical-rally-june-30-2017/

Wednesday 28 June 2017

China’s Inverted Yield Curve, June 28, 2017

If A Yield Curve Inverts In China, Does It Signal A Looming Recession?

The Sevens Report is the daily market cheat sheet our subscribers use to keep up on markets, seize opportunities, avoid risks and get more assets. Start your free trial today.

China's Inverted Yield Curve

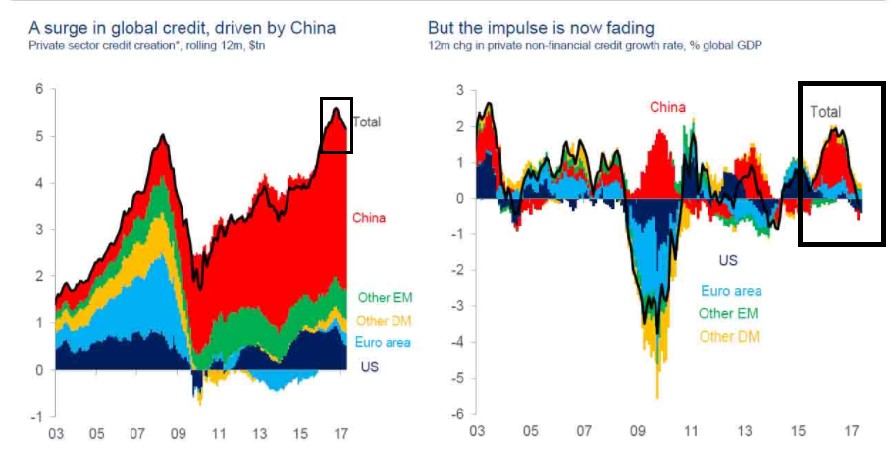
Last week, in our post, “Will Chinese Credit Impulse Impact Global Markets?“, I explained how China remains the largest macro threat to the rally as it begins to deflate its massive credit bubble, a credit bubble that has funded asset bubbles across geographies (Australian property, California property, Treasuries, stocks, etc.).

At this point, it’s just a risk, as there are no concrete signs that the Chinese economy is in trouble, although the Chinese bond market is signaling some caution.

First, it’s well known that inverted yield curves predict recessions. Here in the US, the inverted yield curve predicted the ’81, ’91, and ’00 recession, and the ’08 financial crisis (remember the yield curve inverted in ’05, and stayed that way until the Fed started cutting rates in late ’07).

So, it is noteworthy that the Chinese government bond yield curve is essentially flat, and in some cases has inverted. For instance, as of yesterday the three-year government bond was yielding 3.558%, higher than the 5 year at 3.524%. And, the 7 year was yielding 3.626%, higher than the 10 year, which yielded 3.56%. So, while not a total inversion, it is safe to say it’s flat.

Now, before we go running for the hills and sell stocks, we have to realize this is China, not US Treasuries. As such, liquidity distorts this picture somewhat. For instance, 10-year Chinese bonds are by far the most liquid, so they will move more than other issues. Still, this is not the type of yield curve that implies an economy that is healthy. Again, this matters because the last time we got a Chinese economic scare, it caused the S&P 500 to collapse 10% in a few days… not once, but twice in a six-month period.

Bottom line, I’m not saying get defensive, but I am saying that from a macro standpoint 2H ’17 is shaping up to be more bumpy than 1H ’17, and I want everyone to be prepared. We will be watching China closely for you.

If you feel like at any moment this market could turn around – and in a hurry—subscribe to The Sevens Report. Get smarter, faster.

The post China’s Inverted Yield Curve, June 28, 2017 appeared first on Sevens Report.


source https://sevensreport.com/chinas-inverted-yield-curve-june-28-2017/

Tuesday 27 June 2017

When Will the Decline in Bond Yields Matter?, June 27, 2017

Get the simple talking points you need to strengthen your client relationships with a free trial of The Sevens Report.

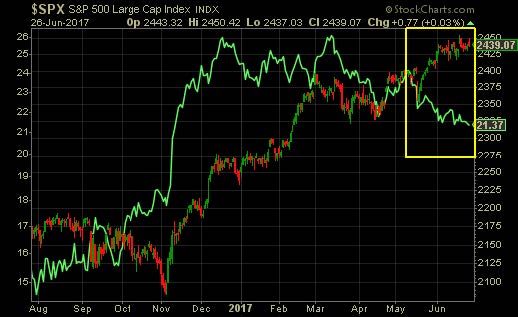
For three months, we and other macro analysts have been warning that the bond market, via falling yields and a flattening yield curve, was sending a worrisome signal about future economic growth and inflation. And, that falling bond yields would act as a headwind on stocks.

Over that three months, the S&P 500 has moved steadily higher.

when will bond market yields matter?

When will this chart matter? The S&P 500 (bar chart) has been diverging from yields (green line chart) for three-plus months. At some point, that gap must close.

Now, given that, it might seem like falling bonds yields don’t matter to stocks. However, decades of experience in this business combined with listening to experienced analysts and traders tells me that bond yields always matter to stocks… it’s just a question of “when” they matter.

Regarding when, most of us are working on a medium/longer-term time frame (i.e. quarters and years), so getting the bigger market signals right is more important than outperforming over a few weeks.

To that point, if bond yields do not reverse in the coming weeks/months, then I am quite sure that over the medium/longer term the stock market is in for a potentially significant pullback. Avoiding that pullback will be the key to multi-year outperformance.

So, the really important question is: “When will low bond yields matter?”

I believe the answer is: When investors realize bond yields are warning about a slowing economy, not lower inflation.

Right now, stock bulls are saying the drop in Treasury yields is just due to declining inflation—not because of potential slower economic growth.

Specifically, they’re pointing to statistical measures of inflation such as the CPI, PCE and the Price Deflator in GDP. Those measures of inflation are falling, which usu-ally means deflation (which is bad for stocks).

But, the bulls aren’t as concerned about falling statistical inflation because, in their view, inflation has changed. Specifically, there is a growing school of thought that in a technology-dominated world, the old inflation statistics (CPI/PCE/Price Deflator) no longer capture true inflation in the economy.

For instance, those inflation statistics are currently being driven down by 1) Lower oil, 2) The Amazon effect, where retail margins are relentless slashed, and 3) General technology making most everyday items cheaper and more efficient.

However, those price declines aren’t bad for the economy, and they don’t reflect the lack of consumer demand that usually accompanies falling prices. Technology and margin compression is making these prices fall, not an unwillingness of consumers to spend.

Meanwhile, asset and other forms of inflation are rising quickly. Over the past few years, home prices are up; rents are up, car prices are up, airfares are up, health insurance is up, tuition is up, the stock market is up and the bond market is up. So, the prices of all the things we “need” are up, but the prices of discretionary items (HD TVs, laptops, tablets, dishwashers, appliances) are down. Since CPI measures consumer goods heavily, inflation statistics are subdued.

Based on this logic, many investors aren’t sweating the decline in bond yields, because they believe, for now, that it’s just reflecting the decline in statistical inflation and not a future slowing of actual economic growth.

The key will be to recognize when investors begin to believe low bond yields reflect slower economic growth. That will be the time to get seriously defensive in asset allocations. Yet as Monday showed, with the market ignoring the soft Durable Goods report, we’re not there yet. But if this data doesn’t turn around, we will get there. Unfortunately, we don’t believe it’s different this time and if bond yields don’t start rising in the near term, then stocks will eventually suffer, like they’ve done virtually every time we’ve seen this type of stock/bond discrepancy.

Join hundreds of advisors from huge brokerage firms like Morgan Stanley, Merrill Lynch, Wells Fargo Advisors, Raymond James and more… see if The Sevens Report is right for you with a free two-week trial.

The post When Will the Decline in Bond Yields Matter?, June 27, 2017 appeared first on Sevens Report.


source https://sevensreport.com/will-decline-bond-yields-matter-june-27-2017/

Monday 26 June 2017

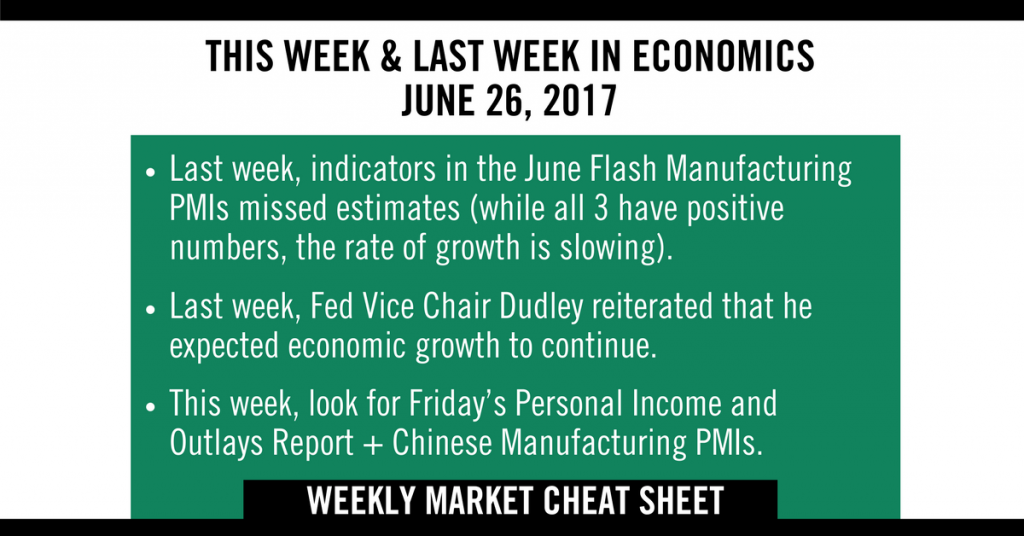
Weekly Market Cheat Sheet, June 26, 2017

The Sevens Report is the daily market cheat sheet our subscribers use to keep up on markets, leading indicators, seize opportunities, avoid risks and get more assets. Get a free two-week trial with no obligation, just tell us where to send it.

Weekly market cheat sheet - sevens report

Last Week in Review:

For a second-straight week, we got underwhelming data and a more-hawkish-than-expected Fed. And for a second-straight week, stocks ignored it. Yet as we keep saying, unless this changes it can only be ignored for so long.

Starting with the former, there was only one material economic report last week, and it came Friday via the June Flash Manufacturing PMIs. Underscoring yet again that the regional surveys (which have been strong in June) apparently have no bearing on the actual national manufacturing PMI, the June composite flash PMI missed estimates at 53.0 vs. (E) 53.6. To boot, both the manufacturing PMI (52.1 vs. (E) 52.7) and the service sector PMI (53.0 vs. (E) 53.7) also missed estimates.

So, at least according to this flash PMI, manufacturing and service sector activity decelerated in June. Now, to be fair, all three numbers (the composite, manufacturing and service PMI) remain in positive territory above 50, so it’s not like activity is outright slowing. However, the level of acceleration continued to decrease in June.

Bigger picture, Friday’s numbers certainly aren’t damning for the economy, but again they are not going in the right direction. And with stocks extended (and a lot of good news priced in), and the Fed apparently more hawkish than we thought, the lack of economic acceleration so far in 2017 is going to become a problem if it doesn’t change.

Speaking of the Fed, last Monday Fed Vice Chair Dudley reiterated that he expected economic growth to continue, and was again dismissive of the disappointing inflation numbers. And, he clearly meant to imply that the Fed remains on course to 1) Begin to reduce the balance sheet in 2017 and 2) Hike rates again.

As with the slightly hawkish Fed meeting of two weeks ago, markets largely ignored the comments. But the bottom line is that the Fed is trying to communicate a more hawkish message to the markets, and the markets aren’t listening, yet. That’s something we’re going to be covering more in depth later this week. The chances of a hawkish “shock” from the Fed are rising (they aren’t high yet, but they are rising).

To end on a positive note, however, housing data bounced back nicely last week. Existing Home Sales and the FHFA Housing Price Index both beat estimates, and countered a very soft New Home Sales report.

Bottom line, over the past two weeks the data has continued to underwhelm while the Fed appears to be more hawkish than most thought. So, one of two things will happen if this continues: 1) Bonds will be right, and the economic data will get worse, which obviously isn’t good for stocks, or 2) Bonds will stop ignoring the Fed’s hawkish message and rates will rise. Either way, it will resolve itself with an uptick in volatility for stocks.

This Week’s Preview:

This week is similar to last week in so much as the important economic data points comes Friday, although on an absolute basis we do get more data this week.

The most important report coming this week is Friday’s Personal Income and Outlays Report, because it contains the PCE Price Index (the Fed’s preferred measure of inflation). If that number is soft, you will likely see the 10- year Treasury yield drop to new 2017 lows (likely below 2.10%, and the bond market’s warning on future economic growth will get louder).

The second most important number this week is the official Chinese June Manufacturing PMI, which comes Thursday night. I covered why China is so important last week in the “Credit Impulse Continued” section of Thursday report, but the bottom line is that if this number drops below 50 (which it shouldn’t, but there’s a chance) people will get nervous again about Chinese growth, and that will become a headwind on markets.

Looking elsewhere, Durable Goods will be reported and it will be yet another opportunity for “hard” economic data to show some acceleration and close the gap between strong “soft” sentiment surveys and hard economic data. Bottom line, next week is truly the key week for economic data, but this week’s inflation numbers (in the US and Europe) and Chinese PMIs will move markets, and give us further color into the state of growth and inflation. If the numbers disappoint, I’d expect lower bond yields… and lower stocks.

Get the simple talking points you need to strengthen your client relationships with the Sevens Report. Everything you need to know about the markets delivered to your inbox by 7am each morning, in 7 minutes or less. 

The post Weekly Market Cheat Sheet, June 26, 2017 appeared first on Sevens Report.


source https://sevensreport.com/weekly-market-cheat-sheet-june-26-2017/

Thursday 22 June 2017

Will Chinese Credit Impulse Impact Global Markets? June 22, 2017

Yesterday’s article: Why Credit Impulse Matters.

If you feel like at any moment this market could turn around – and in a hurry—subscribe to The Sevens Report! Stay one step ahead of the markets.

One of the reasons I watch China so closely (along with other macro analysts) is because for the last decade, every time China has had an economic scare it’s caused global markets to drop, sometimes violently. The most recent examples were Aug/Sept ’15 and Jan/Feb ’16.

More specifically, those two bouts of recent volatility ended at the same time as China massively re-engaged its credit creation machine (think QE) to support its economy. If you look at the chart below, Chinese credit creation declined in ’13-’14 and was flat through ’15.

But when the Chinese economy started to stall in mid to late 2015, officials massively ramped up the credit creation machine again. Maybe it’s just coincidence, but the US stock market hasn’t had a correction since.

Now, China is once again trying to shrink its massive credit “bubble.” And, they’re removing liquidity from the system, as both charts show.

The question for us is: “Will it cause another scare in global markets?”

It hasn’t so far, but that doesn’t mean it won’t.

So, while it might seem odd that I consistently bring up China even when it’s not in the news, this is the reason: Historically when China tries to shrink its credit bubble, bad things happen. And, as they say, history in markets doesn’t repeat… but it does rhyme. So, the focus in the daily Sevens Report will remain on the Chinese economy and credit stats for the next several months.

Help your clients outperform markets—everything in business is a trade-off between capital and returns. See how much you can increase your returns with The Sevens Report.

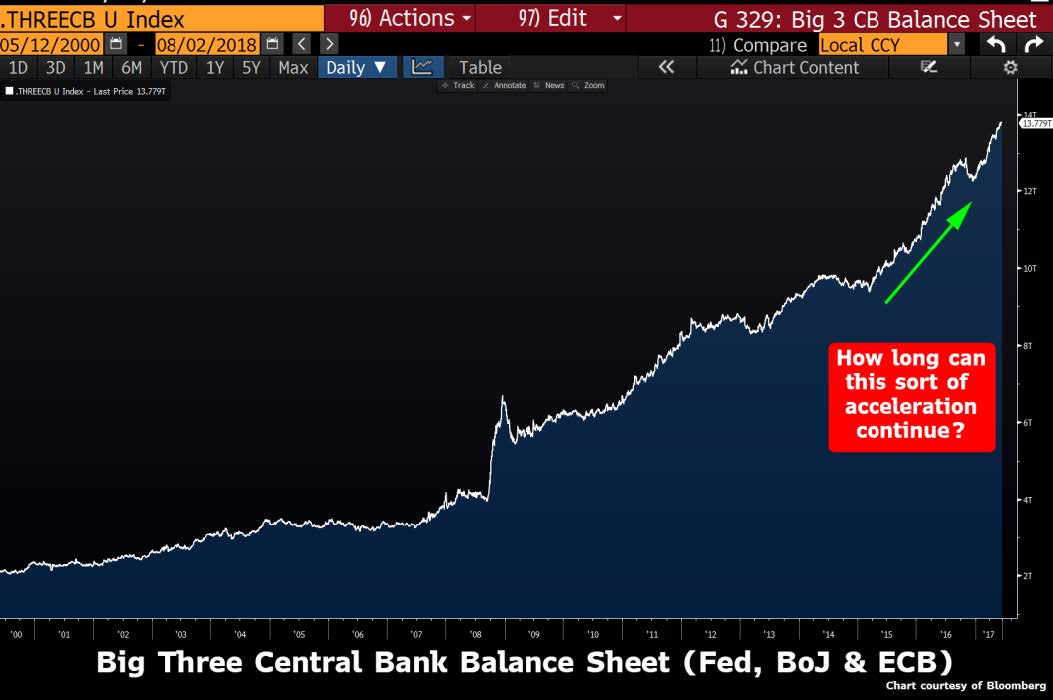
Credit Impulse Continued: This is a chart of the cumulative balance sheets of the ECB, BOJ and Fed. With increases of this magnitude, it’s understandable why stocks have rallied. Of course, that begs the question, “What happens when it starts to decline?”

The post Will Chinese Credit Impulse Impact Global Markets? June 22, 2017 appeared first on Sevens Report.


source https://sevensreport.com/will-chinese-credit-impulse-impact-global-markets-june-22-2017/

Wednesday 21 June 2017

Why “Credit Impulse” Matters to You

Help your clients outperform markets with The Sevens Report—start your free two-week trial today.

There are many analysts and investors who believe that the entire ’09-’17 stock rally is nothing more than the result of a historic, globally coordinated credit creation event from the world’s major central banks. Put in layman’s terms, every major central bank in the world has done QE at some stage over the past eight years, and pumped the world full on cash. So, all they’ve done is create massive asset inflation in bonds, stocks and real estate.
QE Quantitative EasingQE is Quantitative easing. It is a “monetary policy in which a central bank creates new electronic money in order to buy government bonds or other financial assets to stimulate the economy (i.e., to increase private-sector spending and return inflation to its target).”

First, the theory goes, it was China’s central bank (the PBOC) and the Fed unleashing the initial wave of QE following the financial crisis in ’08/’09. Both central banks kept their foot on the accelerators over the next several years (remember QE1, QE2, Operation Twist, and then QE Infinity). In 2013, the Bank of Japan joined the Fed, PBOC and Bank of England at the QE party, only they came to really party, and upped the ante by creating a huge QE program.

Then, as the US and Chinese economies showed signs of life (finally) in 2015, the Fed and PBOC paused their QE/credit creation programs. And, whether causally or coincidentally, 2015 turned out to be one of the more volatile years in the markets in the last decade… and US stocks largely traded sideways until early 2016.

But by that point, the ECB had joined the QE party, and the PBOC restarted its credit creation machine following the economic scare of 2H 2015. So, even while the Fed has stopped QE, on a global basis the total amount of QE and credit in the system resumed a steep acceleration, as now the PBOC, BOJ and ECB were doing QE.

Again, coincidentally or causally, stocks broke out in February 2016, and they literally haven’t taken a break in 19 months (excluding two one-night scares with Brexit and the US election).

So, again, while there is no hard proof that this global expansion of credit has powered US (and now global) stocks higher, there certainly is at least a casual relationship if we look at history.

The reason I am pointing this out is simple: There are growing signs that the near-decade-long global credit creation/QE cycle appears to be nearing the end. First, there are the central bank actions. The Fed is hiking rates, and likely taking steps to reduce its balance sheet, draining liquidity from the system.

Second, the ECB appears to be on the verge of tapering its QE program, and while that will still result in a net credit increase for the next year, the pace of credit creation will slow. Finally, and perhaps most importantly, China continues to aggressively reduce credit in its economy, and I’ll again remind everyone the last time they did that, we got the volatility in 2H ’15.

This is where the “Credit Impulse” comes in.

Credit Impulse is a term used by various research firms that measures the “Rate of Change of Change” of global credit creation/QE. Put simply, while the global amount of credit may still be rising, the pace of the increase has not only slowed… it’s turned negative. Similar to taking your foot off the gas while you’re still going forward. It’s just a matter of time until you stop.

Getting more granular, UBS has been out front on this issue, and back in February noted that Credit Impulse turned negative. In a much-anticipated report out last week, the firm said that the decline over the past three-to-four months has accelerated, with Credit Impulse dropping to -0.6% annualized over the past three months.

Now, Credit Impulse is a composite of various measures of credit, including loans, loan demand and other metrics, so this is not a hard-and-fast number. And the fact that it has turned negative doesn’t mean we’re looking at an impending collapse in stocks.

But if we look at the entire picture, negative Credit Impulse; a more-hawkish-than-expected Fed that’s apparently committed to reducing its balance sheet, a Chinese central bank that is apparently committed to reducing credit in that economy, and an ECB that will begin tapering QE in 2018… the fact is we appear to be nearing the end of the post-financial-crisis credit expansion, and with economic growth where it is, I cannot see how that will be positive for stocks longer term.

Bottom line, I’m not turning into ZeroHedge (although they are all over this), but the fact is that I sense a lot of complacence regarding the end of this global credit creation cycle.

People seem to think that because the Fed ended QE and hiked rates, and then nothing “bad” happened, that this means things will be ok. The only problem is they fail to consider that at the exact time the Fed stopped QE, the BOJ, ECB and PBOC all ramped up their QE programs. That means global liquidity continued to expand, and stocks and Treasuries have been the massive beneficiary.

So, there’s what keeps me up at night, i.e., what happens in 12 months if the only central bank still doing QE is the BOJ? Maybe nothing, but I can’t be sure, especially considering current economic growth.

We will continue to watch the tectonic movements in the global economy for signs of stress, because while we enjoy quiet markets and low volatility now, we appear to be on the cusp of an unknown period where the global punch bowl slowly gets removed from the party. And, I’m bound and determined to make sure we don’t get stuck with the proverbial bill. Food for thought.

If you feel like at any moment this market could turn around – and in a hurry—subscribe to The Sevens Report!

The post Why “Credit Impulse” Matters to You appeared first on Sevens Report.


source https://sevensreport.com/credit-impulse-matters/
Tuesday 20 June 2017

Market Implications of Fed Vice Chair Dudley’s Optimistic Statements

Get the simple talking points you need to strengthen your client relationships—start your free trial of The Sevens Report now.

What are the market implications the optimistic statements from Fed Vice Chair (and President of the Federal Reserve Bank of New York) William Dudley’s optimistic statements this week?

Fed Vice Chair Dudley reiterated and bolstered Fed Chair Yellen’s “steady as she goes” message on rate increases last week, again dismissing low inflation as not a big enough problem to stop the Fed from continuing to hike.

Additionally, Dudley was optimistic about economic growth, saying he thought the current economic expansion had plenty left in the tank.

Bottom line, Dudley reiterated that the Fed is committed to raising interest rates and removing accommodation, and that caused a mildly “hawkish” reaction across currencies and bonds.

It also helped push stocks higher (although stocks were already in rally mode). So, our general Fed outlook remains the same: Balance sheet reduction starting in September, and a rate hike in December.

However, in order for the hawkish tone from the Fed to get the Dollar Index and yields moving higher, we’ll have to see actual improvement in the economic data, and that remains elusive. As such, the market remains skeptical about future rate hikes, despite the Fed’s warnings (Fed fund futures are pricing in just a 20% chance of a September hike, and 40% chance of a December hike). So, the Fed has some work left to do on reestablishing its hawkish credibility after years of ultra-dovishness.

The Sevens Report is the daily market cheat sheet our subscribers use to keep up on markets, seize opportunities, avoid risks and get more assets. Start your free two-week trial today.

The post Market Implications of Fed Vice Chair Dudley’s Optimistic Statements appeared first on Sevens Report.


source https://sevensreport.com/market-implications-fed-vice-chair-dudleys-optimistic-statements/

Monday 19 June 2017

Weekly Market Cheat Sheet, June 19, 2017

The Sevens Report is the daily market cheat sheet our subscribers use to keep up on markets, leading indicators, seize opportunities, avoid risks and get more assets. Get a free two-week trial with no obligation, just tell us where to send it.

Weekly Market Cheat Sheet Preview - June 19, 2017

Last Week in Review:

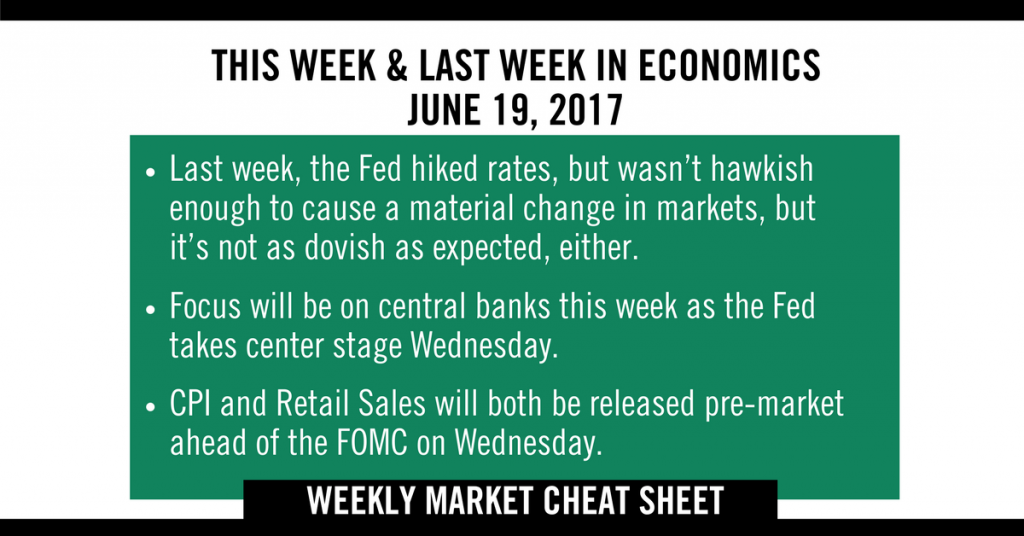
The Fed hiked rates and gave a not-as-dovish-as-expected statement while economic data (especially on inflation) generally disappointed. In sum, it was a week of underwhelming growth and a slightly more hawkish-than-expected Fed, although in a testament to how resilient stocks have been in 2017 neither the data nor the Fed caused stocks to decline.

Starting with the Fed, there were two distinct takeaways: First, the Fed is staying the course on hiking interest rates, despite underwhelming inflation. That is a hawkish shift from market expectations, as while the Fed acknowledged lower inflation, it doesn’t think it’s enough to change policy. Second, the Fed revealed details of how it plans to reduce its balance sheet (a hawkish exercise), and the surprise came when Fed Chair Yellen said balance sheet reduction (i.e. not reinvesting bond principal payments from years of QE) could start “relatively soon,” which likely means September.

Bottom line, the Fed wasn’t hawkish enough to cause a material change in markets, but it’s not as dovish as expected, either… and we think that’s an important distinction going forward (could be bad for stocks and bonds, so stocks lower/yields higher). From a practical standpoint, market expectations now are for balance sheet reduction to begin in September, and for another rate hike in December.

Looking at the actual economic data last week, it was on balance underwhelming. The positives were the June Empire and Philly Manufacturing Indices. The former exploded to a three-year high while the latter dipped but remained solidly in positive territory at 27.6.

Unfortunately, those positive sentiment indicators were undermined by actual May economic data. The gap between sentiment surveys and hard data remains wide, and a risk to the rally.

First, CPI again missed, as the headline declined to -0.1% vs. (E) 0.0%, and more importantly, if we annualize the last three months gains in core CPI it equals 0.0% for the coming year. That is a far cry from the Fed’s 2% inflation target.

Second, May Industrial Production was a disappointment. The manufacturing sub index dropped to -0.4% vs. (E) 0.2%, and while that decline was driven mostly by a drop in auto manufacturing, and is coming off a strong 1.1% April increase, it’s still not a number that’s indicative of an economy in reflation mode.

It was the same with May Retail Sales. The “control” index (which is the best measure of discretionary consumer spending) was flat in May, although there were positive revisions to April (from 0.2% to 0.6%).

Bottom line, the data is “ok” in an absolute sense, but we’ve definitively lost upside momentum, and we need that to restart if the broad economy is going to power this rally higher

This Week’s Preview:

The key event this week will be Friday’s global flash manufacturing PMIs. Specifically, we need to see if the national number can move higher and provide some needed strong data for the markets. Internationally, there shouldn’t be any surprises, and the PMIs should broadly confirm the global rally is indeed underway.

Outside of the flash PMIs on Friday, there isn’t much on the calendar other than some housing data. Last week’s housing starts data was pretty ugly, frankly, as single family starts dropped 4% while single family permits declined 1.9% (permits lead starts by a few months). So, there will be a bit more focus on the housing data this week. Existing Home Sales comes Tuesday while New Home Sales is released Friday. Bottom line, we need strong data to help contradict the worrisome economic signals in the bond market, and the sooner we get that the better.

Get the simple talking points you need to strengthen your client relationships with the Sevens Report. Everything you need to know about the markets delivered to your inbox by 7am each morning, in 7 minutes or less. 

The post Weekly Market Cheat Sheet, June 19, 2017 appeared first on Sevens Report.


source https://sevensreport.com/weekly-market-cheat-sheet-june-19-2017/

Friday 16 June 2017

Political Update: Stay Focused on Taxes, Not Impeachment

Join hundreds of advisors from huge brokerage firms like Morgan Stanley, Merrill Lynch, Wells Fargo Advisors, Raymond James and more… see if The Sevens Report is right for you with a free two-week trial.

Before getting into the market implications of the latest political headlines, I want to remind everyone that any political coverage I give in the Sevens Report is solely from the perspective of the markets, they don’t reflect my preference or lack of preference for any specific politician or party. My personal opinions are not important. What is important is giving you analysis that cuts through the steadily rising amount of sensationalist noise in the financial media (on both sides), and keeping you focused on what’s really moving markets.

That said, given the latest revelations on President Trump, I wanted to take a moment and push back on some of the sensationalism.

Specifically, I want to explain clearly that any talk of impeachment is not realistic in the near term. The reason is simple: Impeachment is a political process, not a legal process. The House of Representatives must start the impeachment process, and since it’s controlled by Republicans, short of having incredibly damning evidence against the president, that simply won’t happen.

In all likelihood, even if Robert Mueller’s commission finds that President Trump likely obstructed justice during the Russian investigation, the evidence would have to be unequivocally conclusive in order to cause the Republicans to impeach. That means we would have to have the equivalent of a video or audio tape of Trump telling someone to break the law.

Obstruction of justice, unlike perjury, is an opinion derived from conclusions; it’s not a hard and fast fact (i.e. you told the truth under oath, or you did not).

So, to be clear, impeachment of President Trump is very unlikely over the next 1.5 years, again because of political reasons, not legal ones (and to be fair to Republicans, Democrats wouldn’t impeach a president either without undeniable evidence).

Now, all this might change if the House changes hands in 2018, and frankly that’s more than possible. On average, the president’s party loses about 30 seats in the House in the first midterms, and the Republicans enjoy a 45 seat majority. So, if the average holds, it’ll be close. If the Democrats take control and this is still an issue, impeachment is a real risk… but that’s a problem for another day.

In the near term, the key is to stay focused on tax reform. Expectations are pretty low at this point, but the market does expect corporate tax cuts in 2018, and the ongoing Russia saga does continue to reduce the chances of that expectation being met.

The biggest risk to stocks continues to be if the market begins to factor in no tax reform in 2018. If that happens, it’ll be good for at least a mild pullback. Taxes, not Russia, remain the number one risk to this rally.

Cut through the noise and understand what’s truly driving markets, as this new political and economic reality evolves. Free trial: The Sevens Report.

The post Political Update: Stay Focused on Taxes, Not Impeachment appeared first on Sevens Report.


source https://sevensreport.com/political-update-stay-focused-taxes-not-impeachment/

Thursday 15 June 2017

Fed Takeaways: What the Hike Means for Markets, June 15, 2017

Fight information overload! Help your clients outperform markets with The Sevens Report—start your free trial today.

FOMC Decision: The Fed increased the Fed Funds rate 25 basis points, as expected.

Wednesday’s Fed decision was not the dovish hike the market was expecting, although it wasn’t exactly a hawkish decision, either (even considering Yellen’s balance sheet surprise). Looking at the statement, the Fed wasn’t as dovish in its language as the consensus expected. The economic growth language remained good, and actually improved a bit from the May statement.

The inflation language, as expected, was downgraded, but the Fed refrained from changing the characterization of risks, and left them “roughly balanced.” That’s Fed speak for “any meeting is live for a rate hike.”

However, the Fed did note the undershooting of inflation recently, and explicitly said they are monitoring inflation, meaning if it continues to underperform they will react with easier policy. For now, the best way to characterize the statement is “steady as she goes,” with regard to the Fed’s current outlook.

Wildcard to Watch: Balance Sheet Reduction

We were right to make this our wildcard to watch, as the topic of the balance sheet provided the only real surprise in yesterday’s Fed meeting.

Importantly, the Fed gave guidance on all three major balance sheet related questions: When will it reduce the balance sheet? How will it reduce the balance sheet? What holdings will it reduce?

What will it reduce: The Fed revealed that it will simultaneously reduce holdings of both Treasuries and Mortgage Backed Securities, which was generally expected.

How will it reduce its balance sheet: The Fed will implement a rising monthly “cap” on principal reinvestments. What that means, practically, is the Fed will not reinvest the first $6 billion of Treasury principal and the first $4 billion of MBS principal, making it a total of $10 billion that it won’t reinvest each month, at least initially. That cap will rise by $10B every three months, so one year from the start date (which will likely be September), the Fed will no longer be reinvesting $50B worth of bond principal payments per month. That number and this escalation is not surprising, and was close to in line with most forecasts (i.e. this wasn’t “hawkish.”)

When will the Fed start Reducing the balance sheet: This was the surprise, as Fed Chair Yellen said balance sheet reduction could start “relatively soon.” That is sooner than expected, as the consensus was the Fed would hike rates again in September, and start to reduce the balance sheet in December. Now, that may be flipped.

Since reduction of the balance sheet is like the Fed hiking rates, this was taken as mildly hawkish, and the dollar bounced along with bond yields. However, this surprise is not a hawkish gamechanger, and won’t alter anyone’s outlook on Fed policy going forward.

Bottom line, for all the noise and production yesterday, the Fed outlook remains broadly the same: One more rate hike and balance sheet reduction in 2017, unless inflation metrics get much worse.

For a monthly cost of less than one client lunch, we firmly believe we offer the best value in the independent research space. Start your free trial of The Sevens Report today.

The post Fed Takeaways: What the Hike Means for Markets, June 15, 2017 appeared first on Sevens Report.


source https://sevensreport.com/fed-takeaways-hike-means-markets-june-15-2017/

Wednesday 14 June 2017

Could The Fed Give a Hawkish Surprise Today?, June 14, 2017

The Sevens Report is the daily market cheat sheet our subscribers use to keep up on markets, seize opportunities, avoid risks and get more assets. Sign up now for a risk-free two-week trial, and see how it feels to be in the know. www.7sReport.com

The simple answer is probably not, but there is a better chance than previous meetings because of one simple reason: Despite two rate hikes since December, in aggregate, “financial conditions” have gotten “looser” in 2017, so Fed rate hikes aren’t really working.

Financial conditions is a term that was coined (for all intents and purposes) after the financial crisis, so we could see financial conditions were getting very tight (i.e. less credit availability) and when liquidity was drying up.

Now, in a post-crisis world, multiple institutions keep “Financial Conditions Indices” that measure the level of interest rates, liquidity in the system, credit availability and other measures of whether the availability of money and credit is getting loose (i.e. more availability) or tight (less availability).

I watch three such indices: (withheld for subscribers—unlock with a free trial). All three have slightly different methodologies, but all generally try and accomplish the same objective, which is to see if financial conditions in the economy are “looser” (i.e. easier credit/more liquidity) or if they’re getting “tighter” (i.e. less credit and less liquidity).

Here’s the important takeaway: All three financial conditions indices have shown aggregate financial conditions getting looser since the start of the year. In fact, in aggregate, financial conditions have eased by the equivalent of a 25 basis point rate cut since 2017 started, despite two rate hikes.

The reasons for this are somewhat obvious: Liquidity remains ample; credit remains readily available, interest rates are down, the stock market and housing prices are up (so more ability to borrow).

From a Fed standpoint, the takeaway is this: The fact that the Fed’s “slow walk” in interest rates isn’t mopping up excess liquidity in the market may make the central bank more prone to get “hawkish,” which again would be positive for banks and cyclicals (i.e. the reflation trade), but negative for defensives and higher-yielding sectors (utilities, consumer staples, REITs).

Again, I’m not saying the Fed will be surprisingly hawkish today, but if I had to bet on a surprise based on these financial conditions indices, I’d bet hawkish over dovish (although I’m making the dangerous assumption the Fed is serious about getting rates back to normal levels).

Bigger picture, though, the takeaway here is that the Fed’s policies, so far, are not having the desired effect. And, if this continues, the Fed will have to “shock” markets with a substantial rate hike at some point if it wants to regain market related credibility—and that increases the risk of higher rates over the longer term (or, higher inflation if they don’t provide that shock).

Join hundreds of advisors from huge brokerage firms like Morgan Stanley, Merrill Lynch, Wells Fargo Advisors, Raymond James and more… see if The Sevens Report is right for you with a free two-week trial.

The post Could The Fed Give a Hawkish Surprise Today?, June 14, 2017 appeared first on Sevens Report.


source https://sevensreport.com/fed-give-hawkish-surprise-today-june-14-2017/

Tuesday 13 June 2017

FOMC Preview and Projections plus the Wildcard to Watch, June 13, 2017

FOMC Preview: Get the simple talking points you need to strengthen your client relationships with a free trial of The Sevens Report.

The Fed meeting is more important than any other this year, for the simple reason that it could either exacerbate the glaring discrepancy between stocks and bond yields (which would be negative for risk assets medium term), or it could help close the gap (which would be positive for risk assets).

Specifically, the bond market has quietly been pricing in the expectation of a “dovish hike” for this meeting via the decline in yields. That “Dovish Hike” means the Fed does hike rates 25 basis points, but makes the statement dovish enough that it doesn’t cause longer-dated yields (i.e. 10- and 30-year Treasuries) to rise. If the Fed executes on that expectation, then we will see the 10-year yield dip and likely test the 2017 lows of 2.14%, and again that is a problem for stocks over the medium/ longer term.

Looking at the actual meeting itself, whether it meets expectations, is dovish, or is hawkish, will depend not only on the rate hike, but also the inflation commentary and any guidance regarding “normalization” of the balance sheet.

What’s Expected: A Dovish Hike. Probability (this is just my best guess) About 70%. Rates: It would be a pretty big shock if the Fed didn’t hike rates tomorrow, so a 25-basis-point hike to 1.25% is universally expected. Statement: In paragraph one, the Fed should include some additional soft language regarding inflation, noting that it’s been soft for a few months. However (and this is important), the Fed should still attribute sluggish inflation to “transitory factors,” implying Fed members are still confident they will hit their 2% inflation goal. Dots: No change to the 2017 dots (so, still showing three hikes as the median expectation). Likely Market Reaction: Withheld for Sevens Report subscribers. Unlock by starting your free trial today.

Dovish If: No Hike or a Very Dovish Hike. Probability (again, my best guess) About 10%. Rates: It’s widely expected that Fed will hike rates, but there’s always a possibility of a surprise. More likely, the Fed will hike 25 bps and accompany it with a very dovish statement. Statement: The Fed changes the characterization of risks from “balanced” to “tilted to the downside,” or some similar commentary, thereby signaling rate hikes are off the table again. This is a very unlikely, but possible change. More likely is the Fed adding considerable language regarding concerns about lower inflation. Dots: A reduction of the dots to reflect just two rate hikes in 2017. Likely Market Reaction: Withheld for Sevens Report subscribers. Unlock by starting your free trial today.

Hawkish If: We get a regular hike, not a “Dovish” Hike. Probability About 20%. Rates: The Fed Hikes Rates 25 basis points. Statement: The Fed does not add softer language regarding growth or inflation in the first paragraph, and instead just largely reprints the May statement, which was dismissive of the recent dip in inflation and growth. Dots: The dots remain the same or even increase one rate hike in 2017 (this is unlikely, but possible). Likely Market Reaction: Withheld for Sevens Report subscribers. Unlock by starting your free trial today.

Wild Card to Watch: The Fed Balance Sheet

The market fully expects the Fed to elaborate on when and how it intends to reduce its balance sheet (i.e. the holdings of Treasuries it has purchased over the years through the QE program).

I covered why the balance sheet is important back in April (a link to that report is here) but the bottom line is that when and how the Fed begins to reduce its balance sheet (the term “normalize” is just Fed speak for “reduce Treasury holdings”) could be a substantially hawkish influence on the bond market, regardless of rate hikes.

Specifically for tomorrow, the key detail the market will be looking for is at what level of interest rates does the Fed begin to reduce its Treasury holdings. The number to watch here is 1.5%. It’s widely expected that at 1.5% Fed funds, the Fed will begin to reduce its balance sheet. If we get one more rate hike this year, then that puts balance sheet reduction starting in early 2018 (likely March).

For a simple reference, if the Fed statement or Yellen at her press conference reveals the Fed will reduce holdings before 1.5%, that will be hawkish. If it’s revealed that the Fed will reduce holdings after rates hike 1.5% that will be dovish.

Bottom Line

This Fed meeting is likely the most important of the year (so far), not just because we will get updated guidance on expected rate hikes and the balance sheet, but also because it comes at a time when we are at a tipping point for bond yields (if they go much lower and the yield curve flattens, more people will start talking recession risk). We also are potentially seeing a shift in stock sector leadership (from defensives/income to cyclicals/ banks), so understanding what the Fed decision means for rates will be critically important going forward. You’ll have our full analysis, along with practical takeaways, first thing Thursday morning.

Join hundreds of advisors from huge brokerage firms like Morgan Stanley, Merrill Lynch, Wells Fargo Advisors, Raymond James and more… see if The Sevens Report is right for you with a free two-week trial. 

The post FOMC Preview and Projections plus the Wildcard to Watch, June 13, 2017 appeared first on Sevens Report.


source https://sevensreport.com/fomc-preview-projections-plus-wildcard-watch-june-13-2017/

Monday 12 June 2017

Weekly Market Cheat Sheet, June 12, 2017

The Sevens Report is the daily markets cheat sheet our subscribers use to keep up on markets, leading indicators, seize opportunities, avoid risks and get more assets. Get a free two-week trial with no obligation, just tell us where to send it.

Weekly Market Cheat Sheet

Last Week in Review:

There were only a few economic releases last week and the Fed circuit was silent ahead of this week’s Fed events.

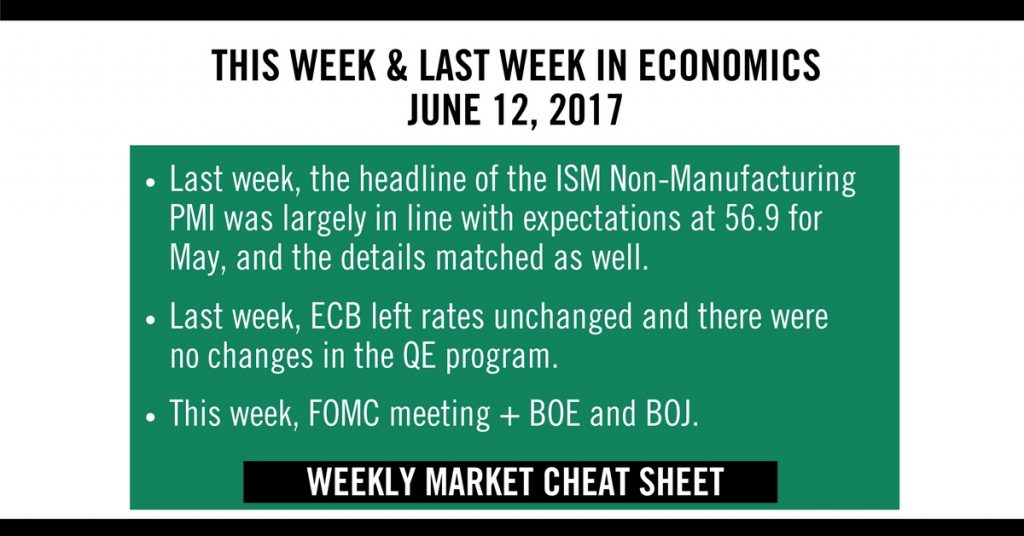
The headline of the ISM Non-Manufacturing PMI was largely in line with expectations at 56.9 for May, and the details matched as well. The one outlier was a sharp dip in the prices category, which fell to 49.2 from 57.6. It was the first sub-50 reading in 13 months. And while the one number by itself is not very alarming, pairing it with other soft price data of late, including the weak unit labor cost on Monday, inflation data is beginning to gain some attention. For now, it is just something to monitor and will not have a material effect on Fed policy yet.

Looking overseas, the EBC decision was the big event last week. As expected, rates were left unchanged and there were no changes in the QE program. The ECB changed their risk assessment to “balanced” and also removed the potential for lower interest rates going forward. Overall, the meeting was anti-climactic as a step was taken towards eventually ending QE, but no update on the timeframe was offered.

This Week’s Preview:

Focus will be on central banks this week as the Fed takes center stage Wednesday, the BOE is Thursday and the BOJ is Friday. The Fed will obviously attract the most attention as a rate hike is expected, but the outlook for future policy has grown cloudier. The market will be looking for any clues as to the number of rate hikes remaining in 2017, or whether the committee’s sentiment towards the economy has changed in recent months. We will have our full FOMC Preview in tomorrow’s Report.

As far as economic data goes, CPI and Retail Sales will both be released pre-market ahead of the FOMC on Wednesday (which we will provide a preview for, as always).

Later in the week we get the first look at June data from the Philly Fed Business Outlook Survey and the Empire State Manufacturing Survey as well as Industrial Production data for May. The latter will be important to see if the recent bounce in manufacturing data has continued at all in Q2 or not. Lastly on Friday, Housing Starts data for May will provide the latest update on the housing market.

Overseas, there are some important releases to watch beginning on Tuesday night with Chinese Fixed Asset Investment, Industrial Production, and Retail Sales all due at 10:00 p.m. ET. There are several second-tiered reports that may move market modestly if there are any surprises, but the only other report overseas really worth watching is the Eurozone HICP (their CPI) to see if inflation is firming at all or actually rolling over as some individual European country reports have shown (German CPI was -0.2 vs. E: -0.1% in May).

Get the simple talking points you need to strengthen your client relationships with the Sevens Report. Everything you need to know about the markets delivered to your inbox by 7am each morning, in 7 minutes or less. 

The post Weekly Market Cheat Sheet, June 12, 2017 appeared first on Sevens Report.


source https://sevensreport.com/weekly-market-cheat-sheet-june-12-2017/